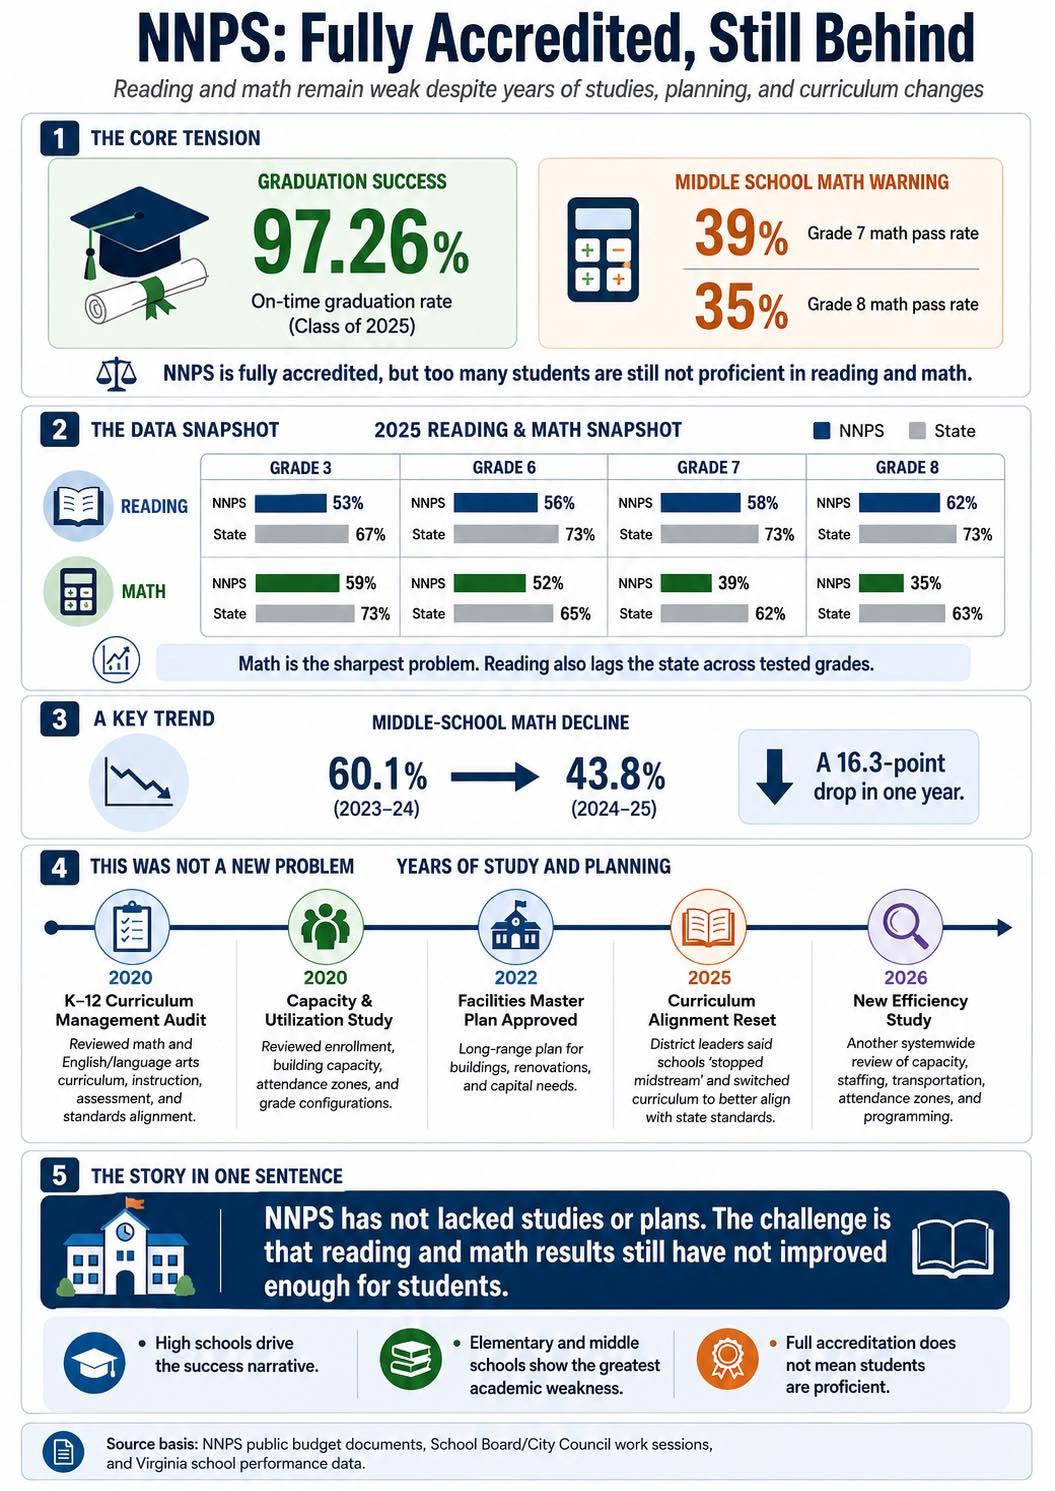
Newport News Public Schools’ full accreditation and reported 97.26% graduation rate deserve recognition. They also leave room for a separate question: how many students are meeting reading and mathematics expectations before they reach graduation?
The May 13, 2026 report examined that difference. Its accompanying infographic identifies the graduation figure with the Class of 2025 and presents a 2025 reading and math snapshot. It reports especially weak middle-school mathematics results and reading below the state in the grades shown. [1] [2]
These are the historical comparisons published with that report. They should not be treated as an update on fall 2026 achievement or a prediction of the next assessment release.
THREE MEASURES, THREE QUESTIONS
Accreditation, graduation and subject-test pass rates are different measures. They should be presented together without using any one as a complete description of students’ experience.
A graduation figure describes an outcome for the graduating cohort. A grade-specific math result describes performance among students included in that assessment measure. A high graduation rate cannot tell a family, by itself, how seventh-grade math instruction is working.
Likewise, a low subject pass rate should not erase graduation success. The purpose of comparison is to identify where support is needed, rather than require the division to choose between recognizing achievement and acknowledging weakness.
Families need the definition, year and population behind each number. Without those labels, measures drawn from different students and stages can sound contradictory when they actually answer different questions.
THE MIDDLE-SCHOOL MATH WARNING
The published infographic lists seventh-grade math passing at 39% and eighth-grade math at 35%. Its combined grades 6–8 comparison falls from 60.1% in 2023–24 to 43.8% in 2024–25. [2]
That is a 16.3-percentage-point decline. Percentage points describe the direct subtraction between the two rates; they should not be confused with a 16.3% relative change.
The grade-specific state comparisons also show sizable gaps: seventh-grade math is listed at 39% for NNPS and 62% statewide, while eighth grade is 35% and 63%. Those differences are 23 and 28 percentage points.
Sixth-grade math is shown at 52% locally and 65% statewide. The lower seventh- and eighth-grade figures therefore belong in a broader middle-school discussion, rather than being hidden behind one overall label.
These results justify questions about curriculum, support and progression through the grades. They do not establish that one teacher, one program or one administrative decision caused the difference.
Nor does a division-level year-to-year comparison automatically describe the same children moving through school. Cohort and assessment definitions must be checked before using the figures to make that claim.
READING DESERVES ITS OWN ACCOUNT
The infographic shows these reading pass rates:
- Grade 3: 53% for NNPS and 67% statewide.
- Grade 6: 56% for NNPS and 73% statewide.
- Grade 7: 58% for NNPS and 73% statewide.
- Grade 8: 62% for NNPS and 73% statewide.
The gaps in those displayed grades range from 11 to 17 percentage points. The concern reaches across the grades shown, even though their local pass rates differ. [2]
A family should be able to see both the division comparison and the result relevant to its school and grade. An overall figure can establish a concern without explaining which students need what support.
The snapshot is also a starting point for questions about intervention. What reading assistance was offered, who could access it and what evidence showed progress? Those are questions for the division to answer; the infographic alone cannot establish that a particular intervention succeeded or failed.
YEARS OF STUDIES AND PLANS
The report’s planning timeline identifies a 2020 K–12 curriculum management audit, a 2020 capacity and utilization study, an approved 2022 facilities master plan, a 2025 curriculum alignment reset and a new 2026 efficiency study. [1] [2]
Those activities have different purposes. A building or capacity plan does not measure the same outcome as a curriculum review. Their existence demonstrates planning, but cannot by itself establish improved subject proficiency.
The accountability question is what each effort changed, who was responsible and how the division evaluated the result. A timeline of completed studies should lead to an implementation account, rather than substitute for one.
The same distinction applies to spending. Appropriating money, introducing a curriculum and delivering effective instruction are connected stages, but evidence of one does not automatically establish the next.
WHAT A USEFUL FOLLOW-UP WOULD SHOW
NNPS can make the next explanation more useful by connecting a small set of decisions to evidence:
- Identify the assessment years, grades and populations used in each comparison.
- Describe the changes made after curriculum reviews and the timetable for evaluating them.
- Show how additional reading and math support reached the students who needed it.
- Explain differences among schools and groups without identifying individual children.
- Report what improved, what did not and what changed in response.
Those are proposed accountability measures, not a claim that NNPS has published none of them. The original report and infographic do not provide the complete implementation and evaluation record.
Comparisons should also explain changes in assessment or accreditation systems before attributing a trend to school performance. Readers need enough information to tell whether a different result reflects a different measure, different students or a change in learning.
RECOGNIZE SUCCESS AND FOLLOW THE WEAKNESS
The graduation milestone matters. So do the reading and mathematics gaps in the published snapshot. A clear public explanation can hold both facts at once.
The division’s planning history makes implementation, follow-through and measurable outcomes the next questions. Another study can supply useful evidence, but the public needs to understand what actions followed earlier recommendations.
Families can ask school and division leaders which supports address the needs shown in their child’s grade, how access works and when progress will be reviewed. Individual student records should be discussed privately rather than posted in public comments.
This report’s conclusion remains focused: reassuring system labels should be accompanied by understandable learning results. Accreditation and graduation are part of the picture; subject proficiency and the response to gaps complete the questions residents should ask.