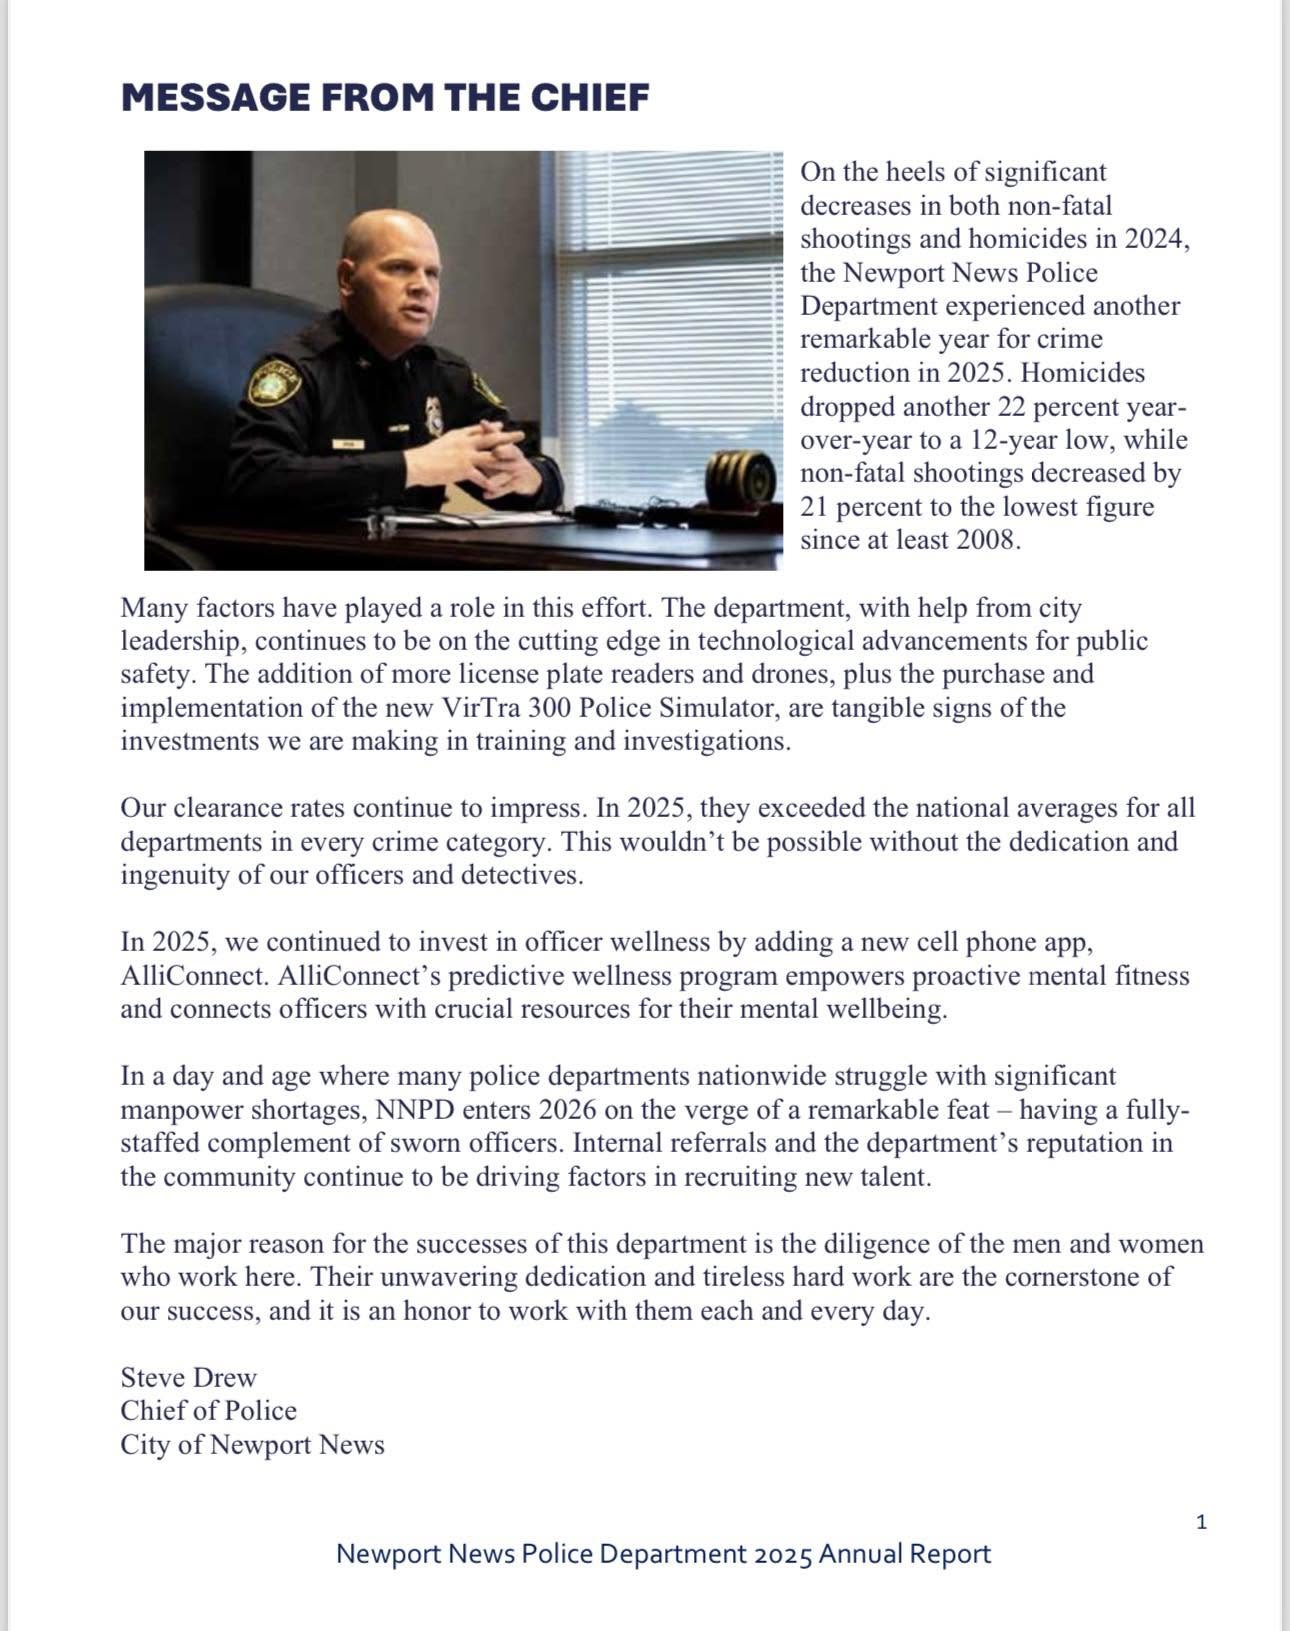
Newport News Police Department’s 2025 annual report records meaningful declines in several crime categories. Recognizing those improvements does not settle whether every headline, comparison and accountability measure is explained clearly.
The original March 14, 2026 commentary raised five questions about that presentation. This edition develops the calculations and distinctions readers need, while qualifying two parts of the original critique: a share near 0.01% is less than 1%, and a negative comparison can reflect the order of subtraction. [1] [2]
The concern is how reliably readers can identify what a figure measures, the period it covers and the conclusion it supports. These questions do not establish that the underlying crime counts were fabricated.
1. WHAT DOES THE HOMICIDE DECLINE MEASURE?
The original commentary quoted a January release describing a 61.70% decrease as a three-year total homicide measure. The calculation compares 47 homicides in 2023 with 18 in 2025.
Subtracting gives 29 fewer. Dividing 29 by the starting count of 47 produces a decline of approximately 61.7%. The endpoint calculation is valid; the description of the measure needs care.
The 2023–2025 counts total 88: 47, 23 and 18. A cumulative three-year total and a percentage change between the first and last years answer different questions.
A clearer account would show the annual counts and identify the start and end years of the percentage decline. That preserves the improvement without making readers guess what “total” means.
It also keeps the shorter comparison visible. The annual report lists 23 murders in 2024 and 18 in 2025, a 21.7% decrease. That year-to-year change and the larger 2023-to-2025 decline can both be correct.
The reporting question is therefore about labeling and interpretation, rather than denying that the count fell. The department can explain the measure directly and use the same definition in its release, table and narrative.
2. HOW SHOULD READERS INTERPRET THE CLEARANCE TABLE?
The murder row displays 100% for NNPD and 57.8% nationally, followed by −42.2%. Direct subtraction produces a 42.2-percentage-point difference.
The sign depends on direction: local minus national is positive; national minus local is negative. A negative sign alone does not prove arithmetic error. The table should tell readers which direction it uses and distinguish percentage points from relative percentage change.
The year labels present another issue. The national column identifies 2023, and the comparison header also refers to a 2023 NNPD rate. The sentence below says NNPD surpassed national averages in 2025. The local column’s year and the relationship between the chart and narrative need clarification. [2]
This edition therefore does not assume the displayed local values definitely represent 2025. Readers should receive a consistent year label before treating the comparison as a matched-period performance measure.
The department should also define clearance, its numerator and denominator, and how cases are assigned to reporting years. Without those definitions, a 100% rate cannot independently explain which cases were resolved or what outcomes followed.
A clear comparison can recognize investigative performance while making the measure reproducible.
3. WHAT DO THE COMPLAINT NUMBERS SHOW?
The report lists 31 citizen-generated complaints and 261,469 calls for service in 2025. Thirty-one divided by 261,469, multiplied by 100, is approximately 0.0119%, which rounds to about 0.01%.
The report’s table already displays .01%. Its description as less than 1% is mathematically true. The original commentary’s sharper objection to that phrase needs this qualification. [2]
The remaining question concerns the denominator and meaning. The table uses calls for service; the accompanying sentence refers to calls and interactions. Consistent language would help readers understand whether they are comparing the same population.
Even a correctly calculated ratio cannot establish the experience of every person who dealt with police. It is a comparison of recorded complaints to the stated activity count, rather than a direct survey of satisfaction.
The report should explain what qualifies as a citizen complaint, how reports enter that count and how its categories relate to other accountability records. Those are definition questions, not proof that residents were prevented from complaining.
Readers deserve the precise ratio and the limits of what it can demonstrate.
4. ARE INCREASES VISIBLE ALONGSIDE DECLINES?
Robberies rose from 158 in 2024 to 171 in 2025. The increase of 13 is approximately 8.2%, as shown in the annual report.
That increase does not erase reductions in homicides or other categories. Nor should the reductions make robbery disappear from the public explanation.
The useful account is category-specific: identify the change, explain its scope and describe the response. A single favorable overall message cannot tell a resident whether the concern relevant to that resident improved.
The report’s table makes the robbery increase available. The commentary’s question is how prominently officials discuss it alongside the improvements they emphasize.
For later comparisons, consistent periods and definitions matter more than selecting whichever starting point produces the strongest headline. Both improvements and increases should remain visible.
5. WHAT CONTEXT COMPLETES THE ACCOUNTABILITY PICTURE?
The original commentary identified 199 Internal Affairs allegations and 134 substantiated findings alongside the 31 citizen complaints. Those are different measures and should not be treated as interchangeable counts.
An allegation count is not automatically a count of unique officers, complainants or incidents. Without an explained relationship among the categories, adding them to citizen complaints could count overlapping matters more than once.
The department can make the picture clearer by explaining the categories, how findings relate to investigations and what follow-up the published totals represent. A number becomes more useful when its unit and outcome are stated.
The original commentary also sought population context for crime counts and a definition of gun violence. Those are reasonable presentation questions; a broad phrase should not imply a standardized category unless the report identifies what it includes.
WHAT A CLEARER REPORT WOULD PROVIDE
Chief Steve Drew and the department can answer these questions with labeled annual counts, consistent comparison years, stated formulas and definitions for complaint and Internal Affairs measures.
The same public account should retain both genuine crime reductions and categories that increased. Clarifying a label is useful even when the underlying calculation is correct.
This remains commentary on the reports discussed, rather than a new incident investigation or a current crime forecast. Its standard is practical: a resident should be able to identify the source, reproduce the calculation and understand the limits of the conclusion.